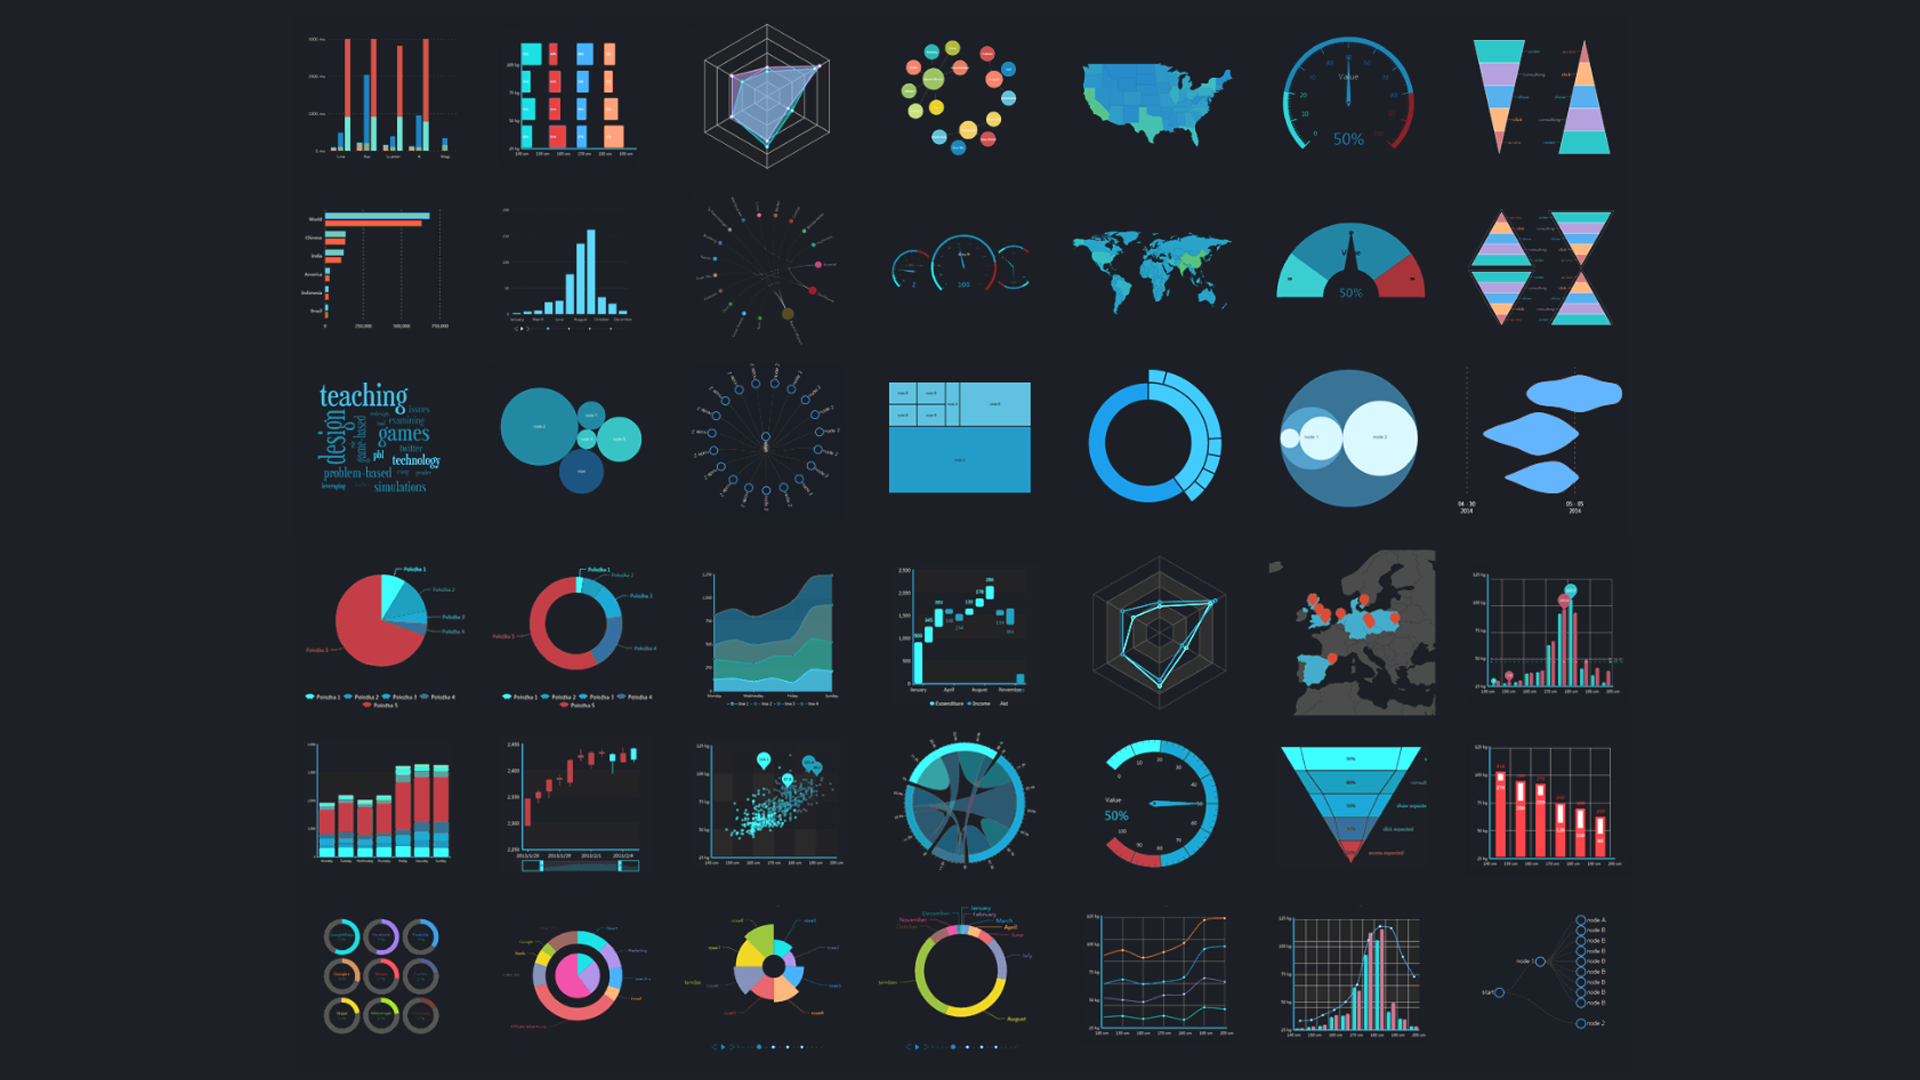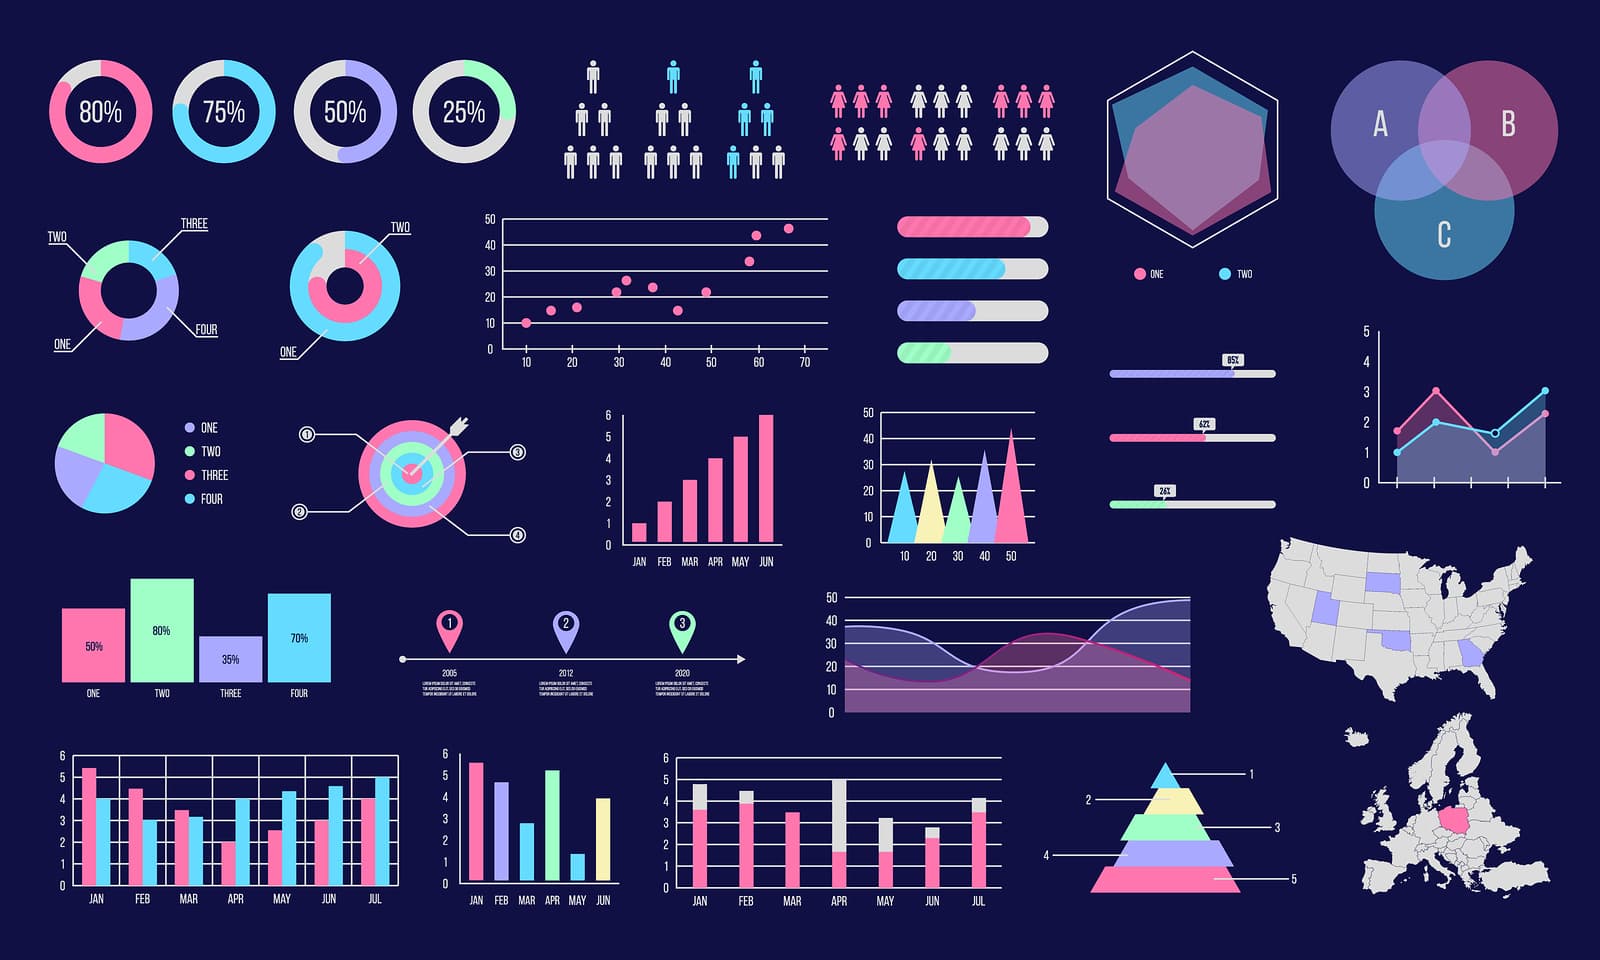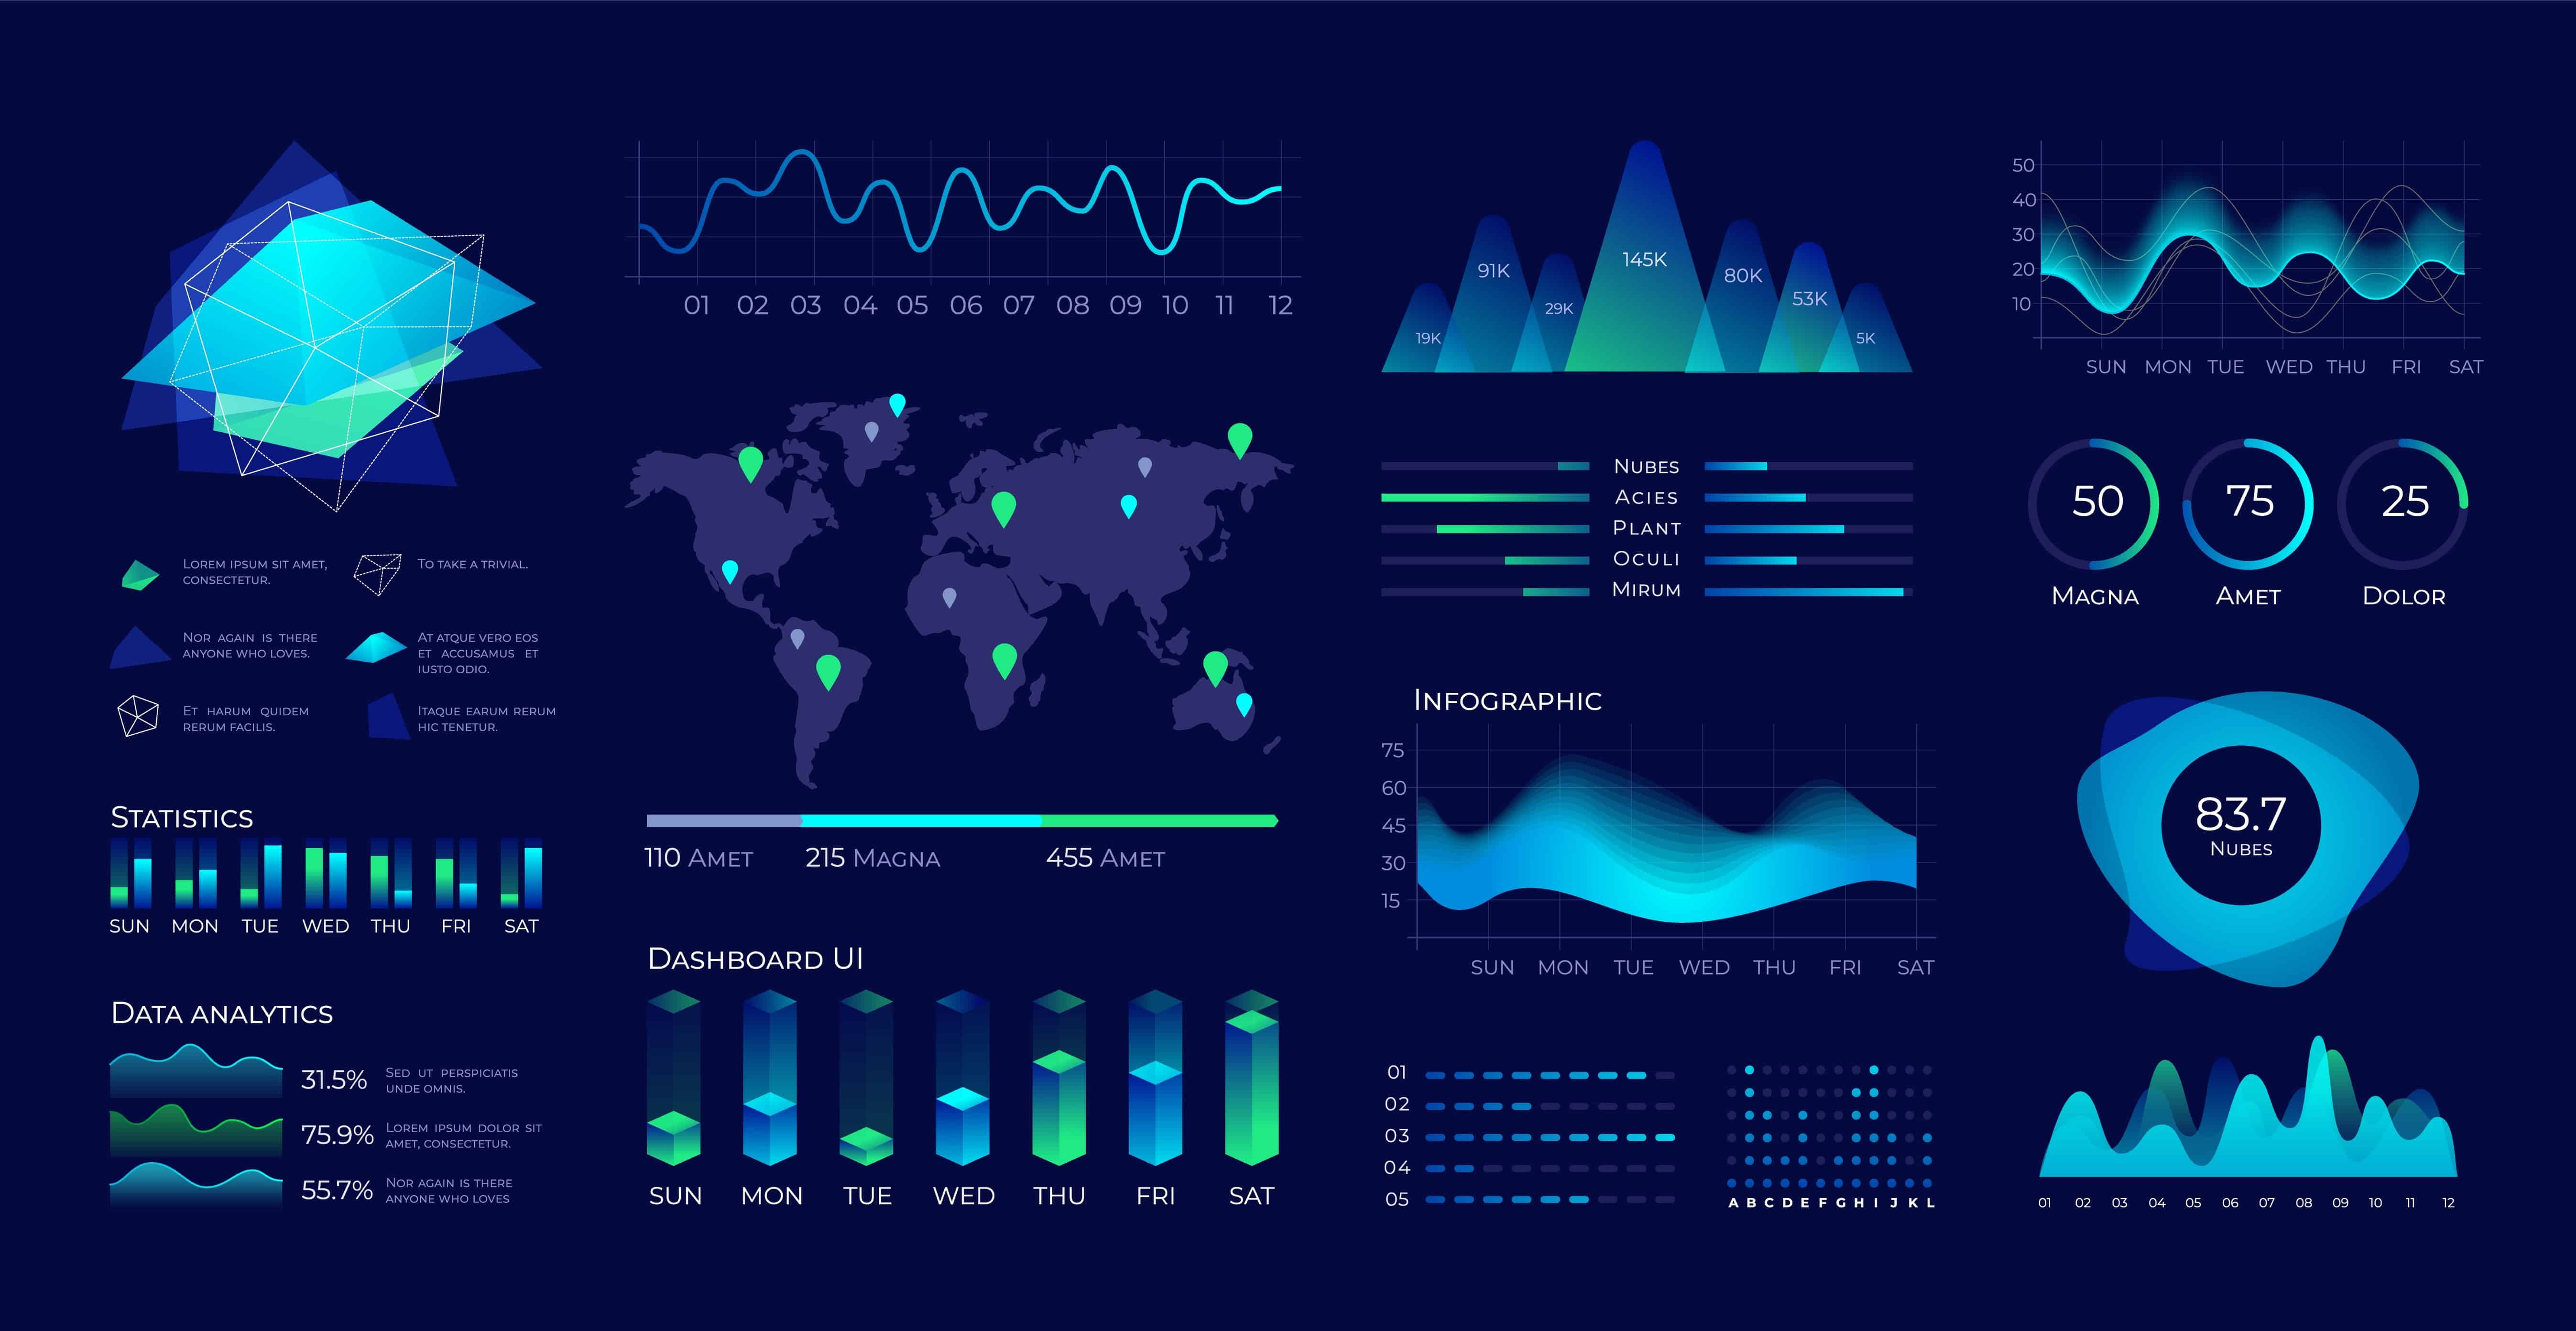
Data visualization is a game-changer for businesses seeking to unlock the insights hidden within their data. By transforming complex data into stunning graphics, it allows you to see the big picture in seconds. Visualizing data helps decision-makers gain a deeper understanding of their business by uncovering trends, patterns, and key insights. It also enables you to communicate your findings in a captivating and memorable way, impressing clients, investors, and stakeholders. With data visualization, you can tell your data-driven story with clarity and conviction, empowering your team to make smarter decisions and stay ahead of the competition. So why settle for dull spreadsheets and charts when you can bring your data to life with eye-catching visuals?


© 2021 Beta Charts Software Co. Ltd. All rights reserved.
205 - 3025 Anson Ave.
Coquitlam, B.C.